Cyber analysts using Elemendar’s READ. AI for CTI application can now analyse multiple cyber threat intelligence (CTI) reports together! This is the ability for a user to combine the analysis from multiple documents into a single view for further analysis. Read on to see this illustrated using READ.’s inbuilt graph viewer function, via a visual result of the multi doc concept.
So what?
At its core, intelligence analysis is about spotting commonalities and variance between data sources. Commonalities provide assurance of the validity of assessments, and variances create opportunities for new and alternative hypotheses to be generated. Any good analyst tool facilitates this process and there are a number of these in common usage. However, what differentiates Elemendar’s READ. platform is its ability to empower the analyst to conduct structured analysis on unstructured text drawn from HTML, PDF or plain text as an input source.
Within this context, the importance of ‘multi-doc functionality’ is that the analyst can combine data from multiple separate document sources to draw insight from the combined view.
Shown below is an example of this and is a chart showing a simplified version of the graph in Figure 1
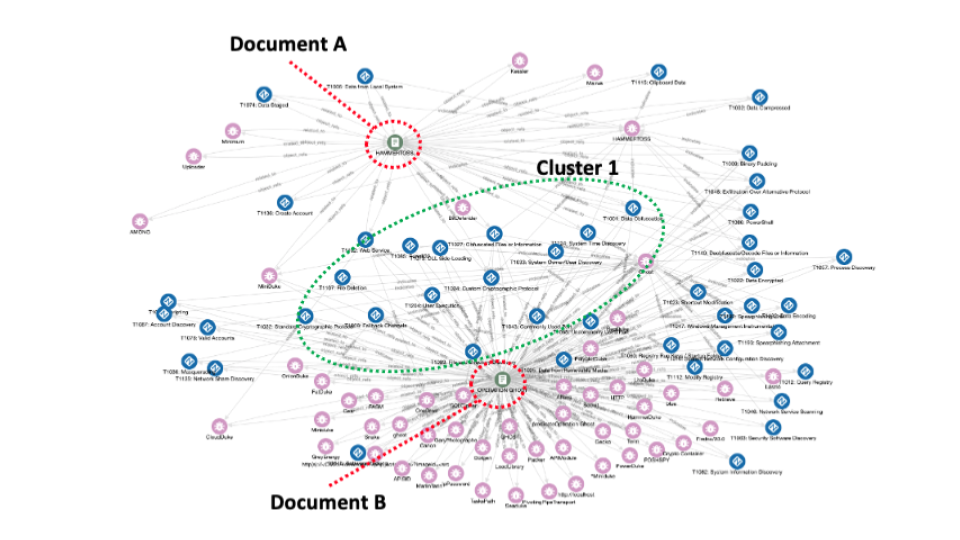
 Figure 1: Grid view of entities extracted from two documents marked A and B

Figure 2: Multi Document visualisation on READ.
As in Figure 1 the two source documents are highlighted as A and B. However, in this instance the visualised entities have been limited to MITRE ATT&CK Patterns (blue Zs) and malware types (pink spiders). Without getting too much into the analytical details, the importance of Figure 2 is the MITRE ATT&CK Patterns that are shown in Cluster 1; for a CTI analyst being able to see the common Attack Patterns between two data sources is often the first step to a deeper insight into the question at hand.
If we look at the history of CTI analysts, an excellent example of the power of the type of approach that this blog has advocated is Mandiant’s Supply chain analysis: From Quartermaster to Sunshop. Shown below (figure 3) is a graphic taken from Mandiant’s report highlighting how the approach of structured data combined with visual graphing can be combined to draw a powerful “so what?” assessment from data.

Figure 3: Graphing and visualisation in Mandiant’s Supply chain analysis: From Quartermaster to Sunshop
Additional features
Of course, READ. has the power to graph more than the two documents that have been shown within this short blog. In addition, this tool has the functionality to allow the user to specify which entities the tool can extract and how documents can be clustered together, according to intelligence requirements. Features such as this are all useful for the analyst but when combined, they expand the range of Elemendar’s READ. tool from a novel “nice to have” to a more industrial strength capability that can be integrated into the analyst workflow.
Given that a huge volume of CTI data is siloed within PDF and text documents, the addition of Multi-doc analysis and management is a huge step forward for the READ. platform and lays the foundation for some of the product improvements that we have planned for the year of 2022.
Elemendar is the world leader in developing AI (Machine Learning) to process human-authored cyber threat intelligence into machine-readable, actionable data, to enable cyber analysts to better protect their organisations against cyber threats.
Stewart Bertram is Elemendar’s Head of CTI with more than 15 years experience in Intelligence and Cyber Threat Intelligence in both public sector and private roles.