Disinformation works best when blended with a drop of truth. Consider the Philadelphia Experiment (BS) combined with degaussing technology research (truth). Or microchips in vaccines (BS) with the Tuskegee Syphilis Study (truth).
The recipe is clear: Just as a spoonful of sugar makes the microchip-laced medicine go down, if you combine blatantly false claims with something true at its core (but exceptional), you create a hybrid that is viable within the modern information environment.
The key element is the ratio, and how this can change depending on the disinformation being pushed. For example: does the COVID-19 vaccine have unintended side effects, up to and including the death of a tiny fraction of those who took the vaccine? Yes, this is an established fact, but a long way from a deliberate attempt at global population control by a shadow world government – the so-called Plandemic. In this case, the BS-to-truth ratio is something like 90% BS to 10% truth.
What is needed here is some kind of objective scale to measure a piece of disinformation against. The truth is out there – it’s just a question of quantifying it.
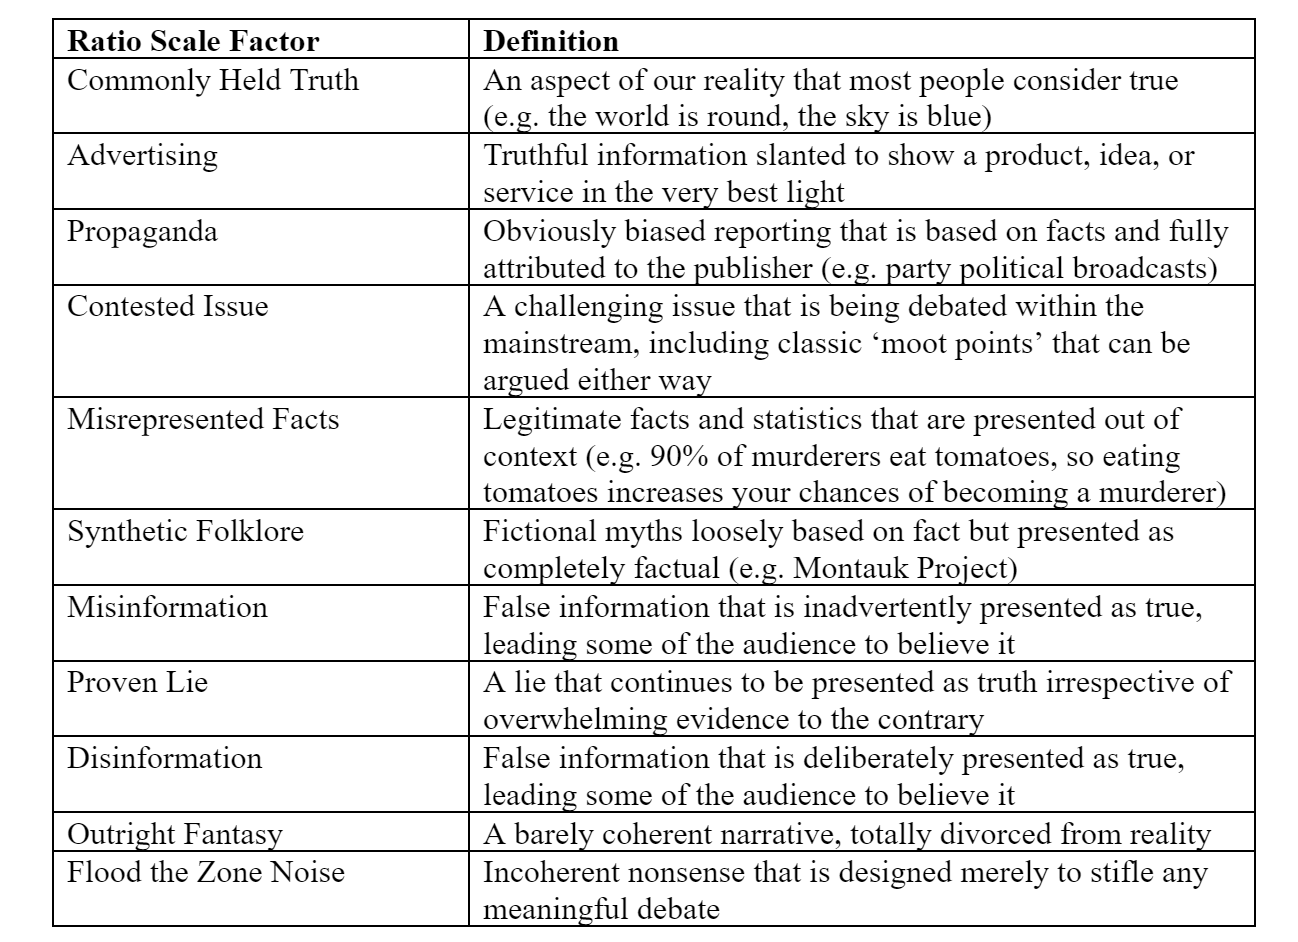
Truth-2-BS Ratio Scale
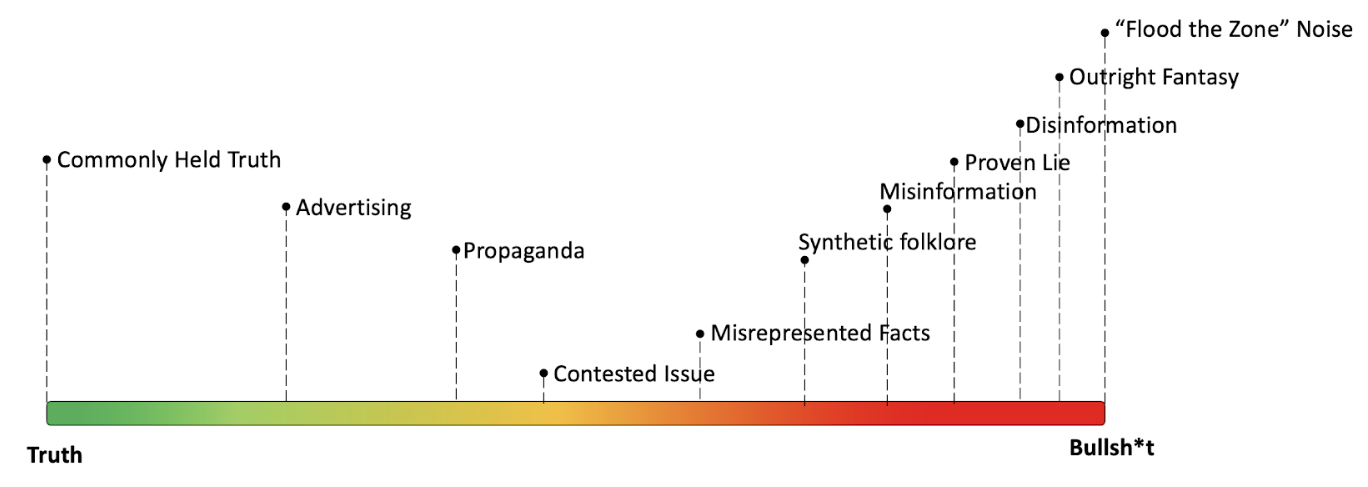
Figure 1: A Proposed Ratio Scale
Figure 1 shows an explainable, analytical scale to broadly plot the nature of disinformation. (At the end of this blog, we’ve defined the categories it uses.) Here’s how to use the scale:
- Identify a piece of disinformation (large or small, it doesn’t matter). Best to choose a defined artefact or set of artefacts, like a manifesto, video, tweet, etc.
- Set the truth (lower bound) of the piece of disinformation: the kernel of truth that the wider disinformation narrative is spun around.
- Set the (upper bound) of the piece of disinformation, giving you your truth-2-BS ratio.
It’s up to the analyst to define the exact percentages of truth for each boundary calculation.
The utility of the scale comes from the variance between the truth and the BS boundaries. For an example, see the scale below applied to disinformation about COVID-19.
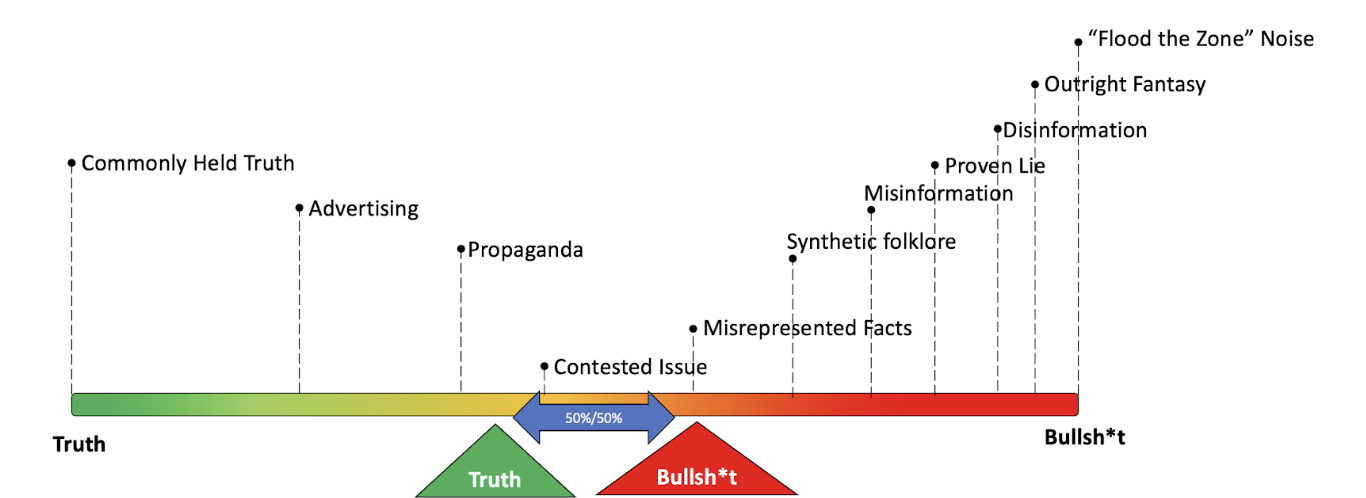
Figure 2: The Ratio Scale Applied to COVID-19 Disinformation
Notice the close boundaries between truth and BS. In our view, this plot accurately captures much of the core discourse surrounding COVID-19. That discourse is characterised by significant confusion about what is a legitimate fact and what is not.
Now let’s apply the scale to the QAnon conspiracy…
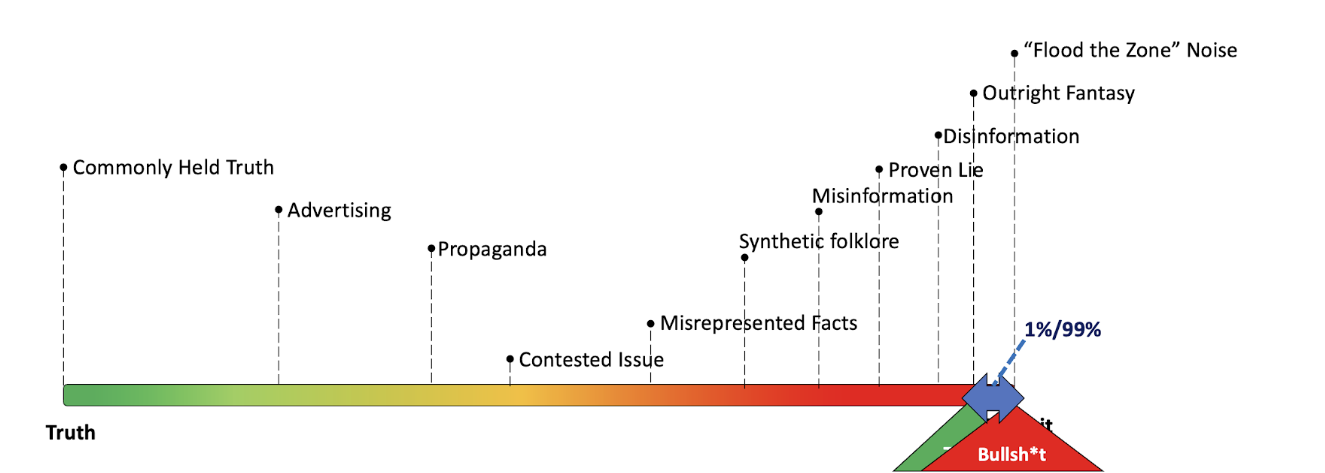
Figure 3: The Ratio Scale Applied to QAnon Disinformation
QAnon is grudgingly given 1% for truthfulness, as it at least involves some real people and places. For the most part, the theory is outright fantasy, at best. At worst, it’s simply ‘Flood the Zone’ Noise.
How Useful Is the Scale?
From a descriptive perspective, the scale above usefully enables an analyst to compare and contrast the current disinformation with historical cases of disinformation, by mapping each to the scale. More importantly, the scale can inform the response to disinformation.
Take the two examples we have charted above – regarding COVID-19 and QAnon. These two strands of disinformation have much in common, but plotting them on the scale highlights their differences.
When considering how to counter these disinformation campaigns, you could adopt the following approaches, based on insights offered by the scale.
- COVID-19: Because the main locus of this strand of disinformation sits between the Contested Issue and Misrepresented Facts section of the scale, an approach revolving around debunking and education about the facts could be productive.
- QAnon: Because this disinformation dwells within the Outright Fantasy and Flood the Zone Noise areas of the scale, an approach based on reason and debunking is unlikely to yield positive results. Greater benefits might be found by depicting QAnon as more analogous to a religious belief system, and offering strategies for challenging that system.
Where Do We Go From Here?
Disinformation is a multifaceted threat. One of its major features is its ability to blend truth and lies into a superficially believable narrative. At some point, the study of disinformation must be linked to a counter-response. But new taxonomies and scales of measurement need to be developed for the analyst to at least know what they’re dealing with.
The basic scale we presented above should help the analyst start disambiguating truth from fallacy, but the framework is purely qualitative. More development, with more formal statistical measures, would make it more robust and potentially interoperable with other frameworks of disinformation analysis. For example, the DISARM framework, Disinformation Kill Chain by MITRE Corporation, and Diamond Model for Influence Operations Analysis.
Any tool that helps discern facts amid fiction will go a long way to countering the spread of disinformation.